Pricing: managing one of the most powerful levers in business
Pricing: managing one of the most powerful levers in business
An example of our work done in Sales
For all companies – no matter in which industry – pricing is a key business lever. In certain industries it is also “the” most important lever of all. The following example – taken from our direct experience with a key client of ours, a major industrial player – very well illustrates the impact and value that we are able to create by working on pricing. This company had engaged us to help them turn around their economics, which had been showing negative profitability for the last couple of years, so having extremely little time to solve the situation.
To do this, we applied our proven methodology to tackle pricing. First of all, assessing the potential of the different business levers, we realized how important working on pricing would be for this client of ours. The following graph of ours shows in fact the “Price cascade” – from List Price Sales to Net Price Sales – of our client prior to our intervention.
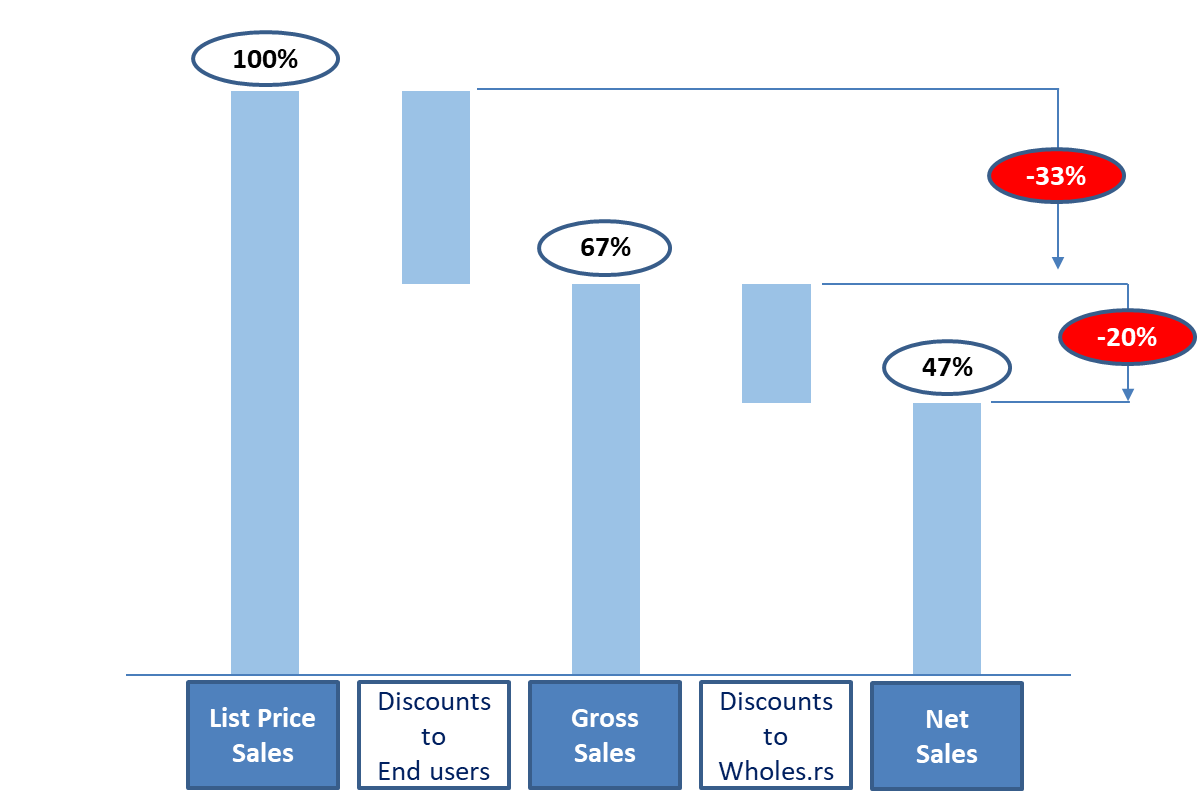
As you can see, more than 50% of pricing – and therefore, of profitability – was gone in discounts. Given the fact that this company’s loss was of a few percent points, just being able to improve pricing of a small percentage (out of the instead big 53% loss in the Price Cascade) would completely solve this Company’s bad situation, without even having to think about improving also other business levers. Also, working on pricing is something that can be done much quicker than other levers: you do not have to invest, or to build plants, or to layoff personnel, or to expand your geographical presence,… But – we were told by this Company’s Management – it was simply impossible to improve their pricing: they had – they were saying – running it for more than a decade, optimizing it in its most tiny details. Well, this was not at all the case.
We in fact discovered that not only were they having wrong Pricing Strategy & Daily Management, but that they were also using wrong pricing “logics”: they had in fact been trapped – as we have discovered true also for other key companies in the world we have supported – in what we call the “Net Price Trap”. Illustrated by the table below.
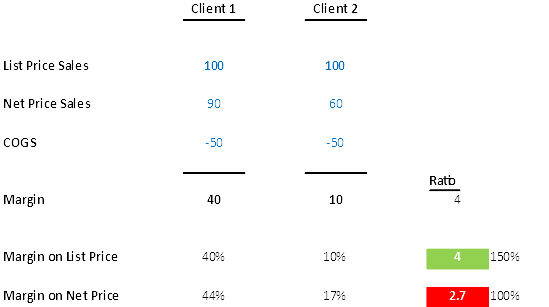
If we are looking at the two clients above, Client 1 is with no doubt a better client of ours than Client 2: providing us with a Margin of 40, as opposed to a margin of only 10 by Client 2. So, by how much Client 1 is better than Client 2? Very simple, by a factor of 4: at parity of sales (both clients have in fact purchased the same amount of our products/services) Client 1 generates in fact 40, while Client 2 only 10. There is no discussion about this. If, to measure profitability generation, we use the correct indicator – i.e. the Margin on List Price – we get the correct picture. If, on the other hand, we use the wrong indicator – the Margin on Net Price (i.e. the Margin taking the Net Price, instead of the List Price, as denominator), we have a totally wrong image of what is going on. As it is shown in the graph above, the Margin on Net Price indicator makes in fact a huge mistake: 2.7 ratio vs the correct 4. It is a 50% mistake! It is like to look at pricing … forgetting the most important thing of pricing: discounts.
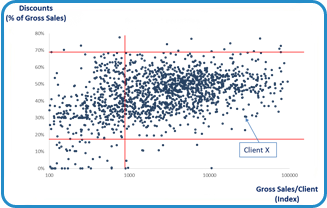
This is the “Net Price Trap” that we were talking about, and that our client had been caught into prior to our arrival. Let’s see what this bad pricing management had caused to them, with real numbers. Usually you expect that discounts increase with the size of the sale (this is the first rule of pricing of any business on earth: the “volume-discount rule”), as shown in the illustrative graph below.

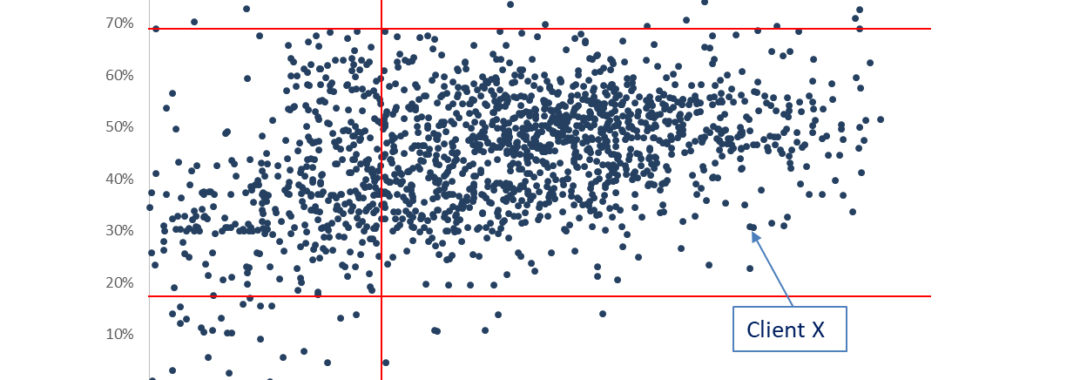
Let’s now see instead the concrete picture of our client’s situation prior to our arrival, with real numbers (below).
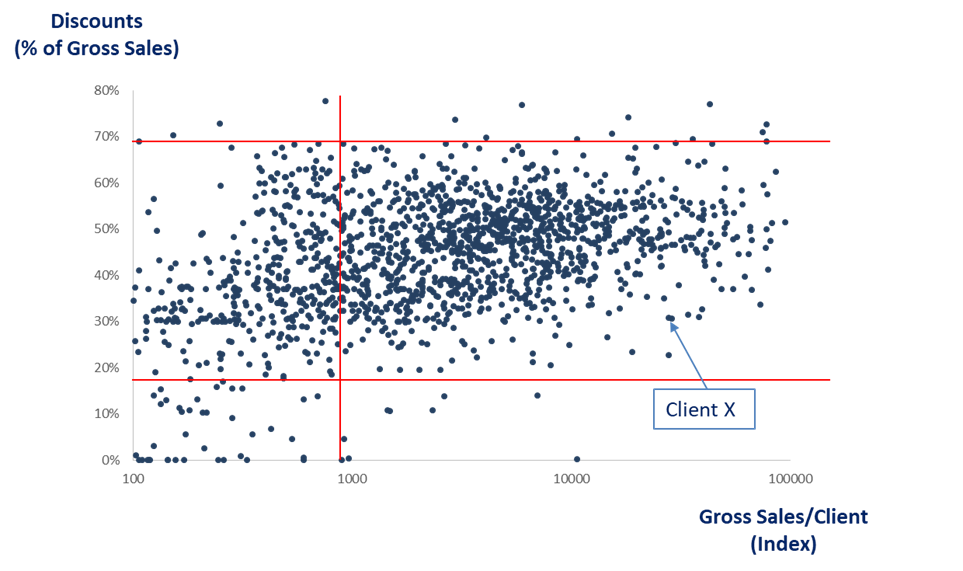
As we can see from the graph:
-
Not only there was no correlation whatsoever between Discounts and Sales (meaning that they were rewarding small clients with the same level of discounts that they were giving to those clients that instead were buying a lot from them; and, in a number of cases, with even greater discounts)
-
But also the magnitude of discounts was huge, going from a normal 20-30% to ….. 70-80%! (meaning that a number of clients, actually a big number of clients, were completely unprofitable to the company, not even able to pay just the COGS).
When our client saw the above picture, they were astonished, with no words, realizing that their pricing was totally out of control. All their beliefs in their ability to set and manage Pricing had been wiped out, in a second.
The issue was that their bad management of Pricing not only had affected the management of their clients (that the Graph above is a picture of), but also:
-
the management of their Products (there were Product Lines that they were thinking were profitable which instead were unprofitable)
-
the management of their Wholesalers/Agents (same here, there were Wholesalers/Agents that they were thinking were generating profits to them which instead were not at all; and let’s remind here how huge the Price Cascade gap from End-Users to Wholesalers/Agents was: 33% profitability loss, with a dispersion that adds on top of the one shown above).
By rebuilding their Pricing – just by that – it was then possible to completely turn around the Company’s economics, saving its life and future.
